- Call us 0086-15152013388
- Contact us roc@plywood.cn
-
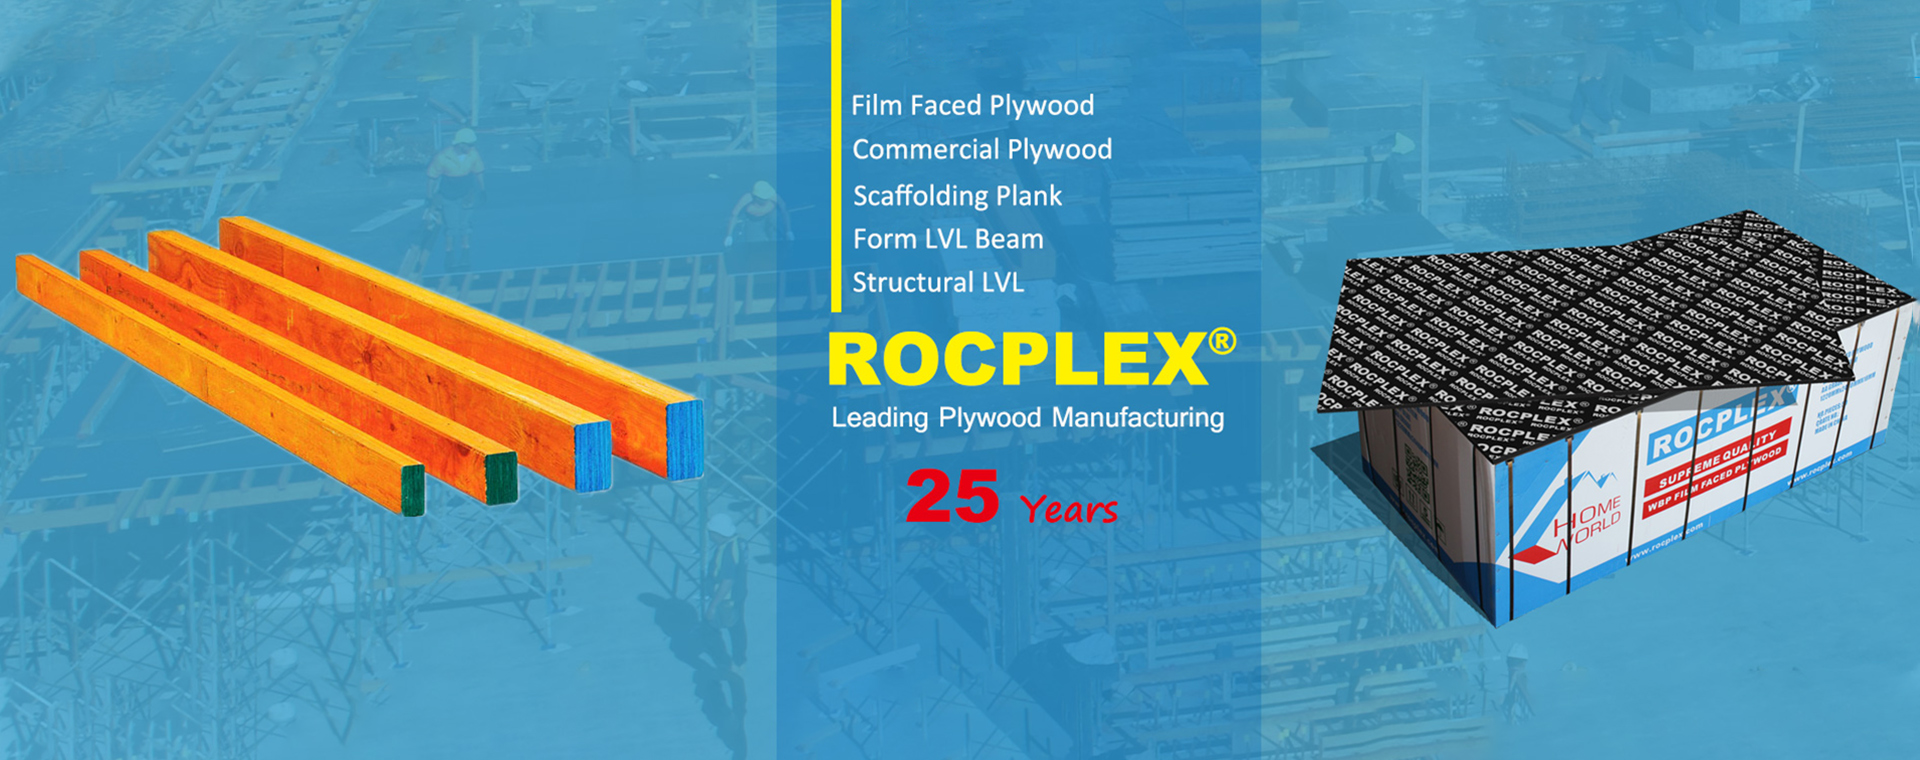
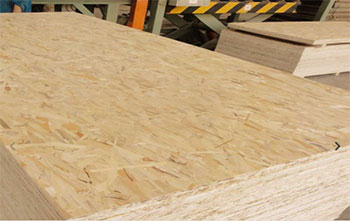
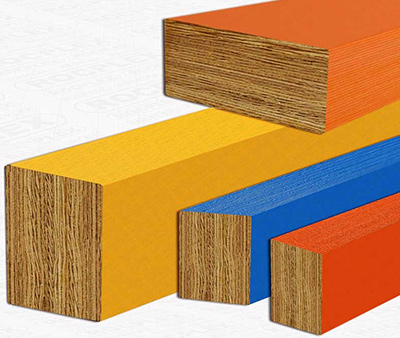
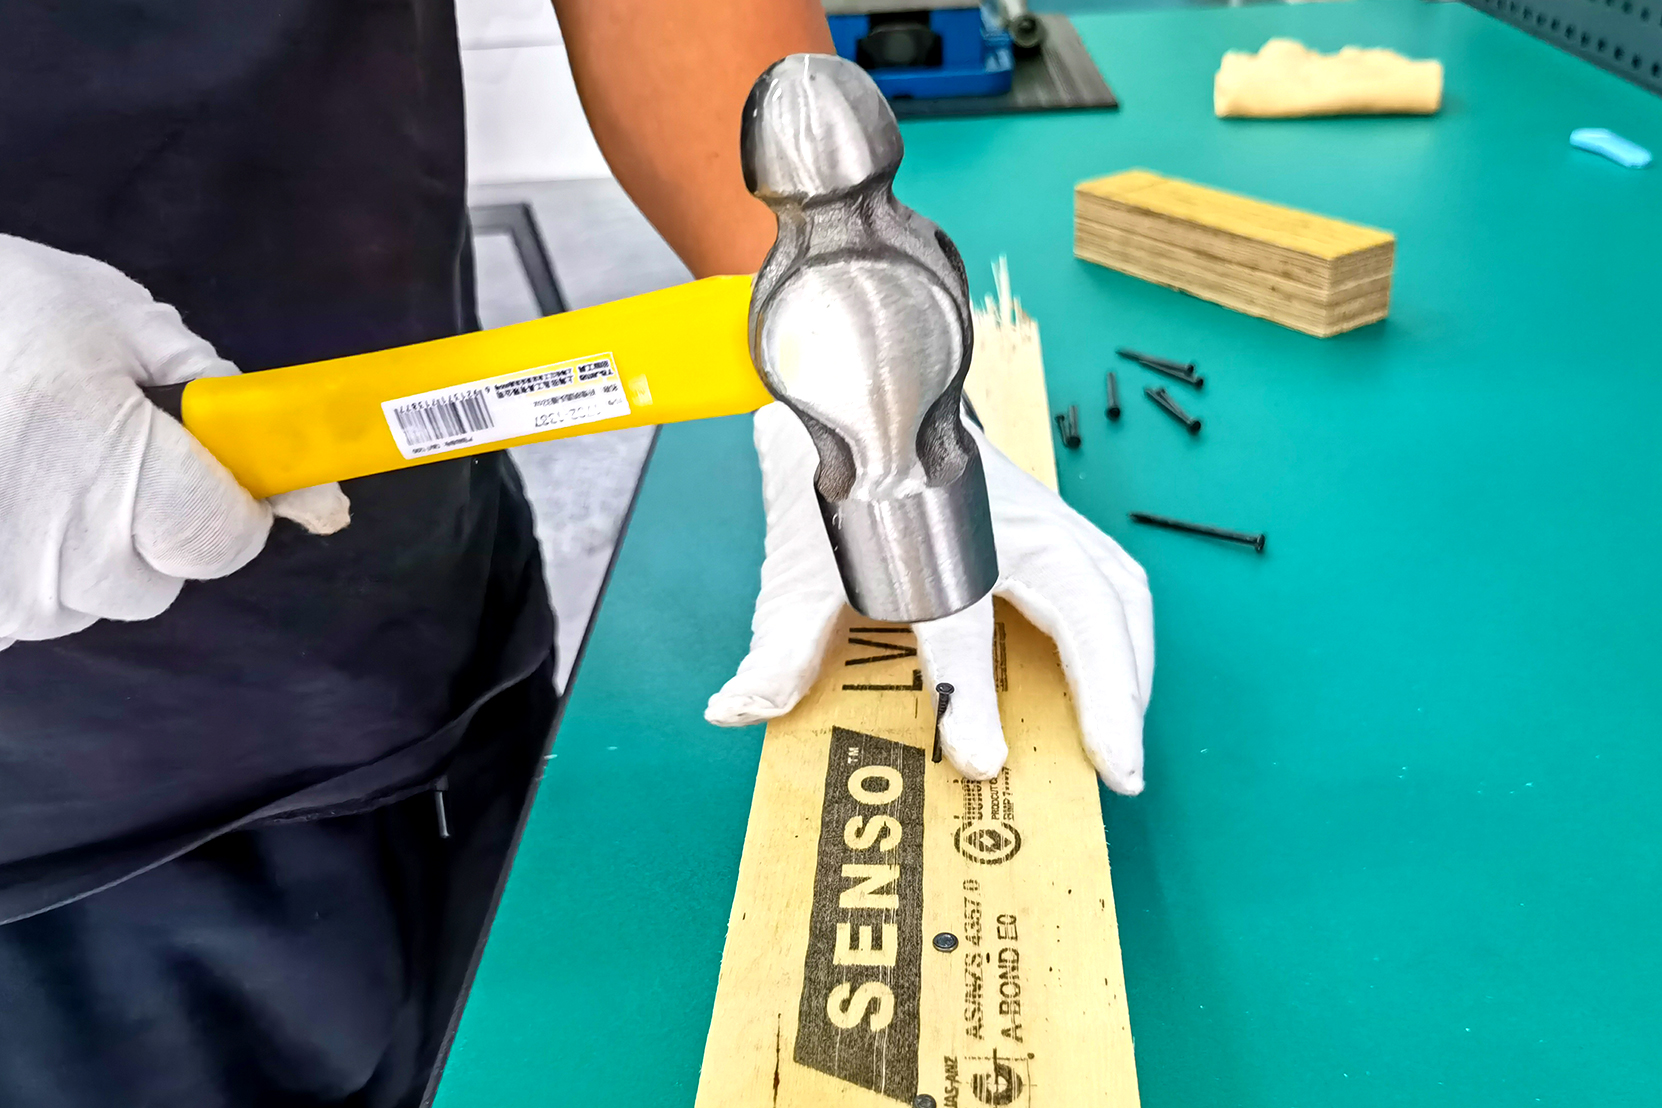
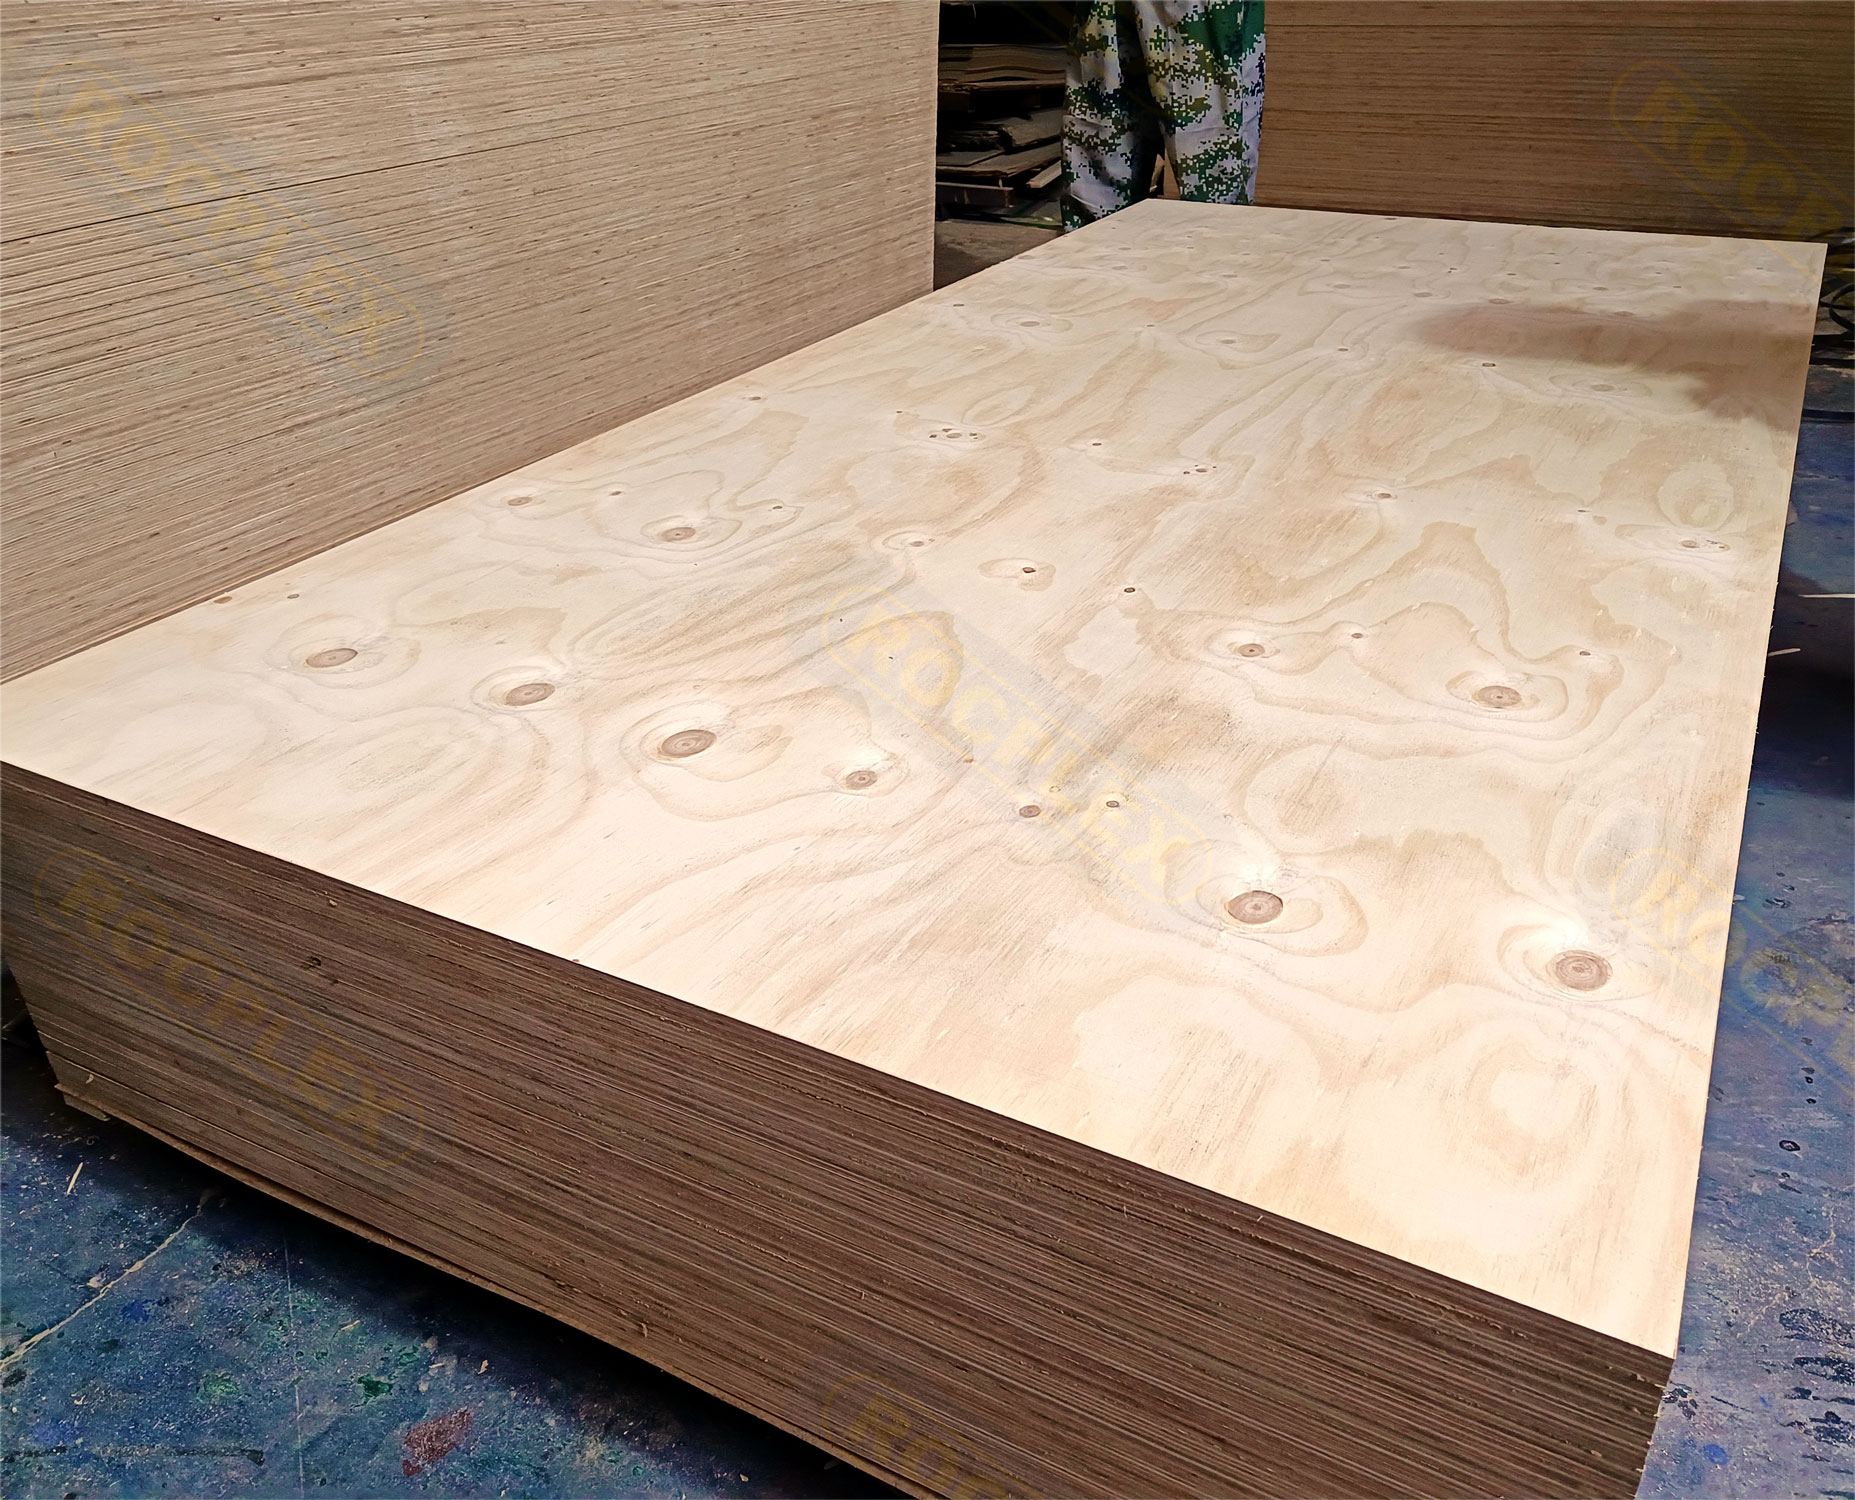
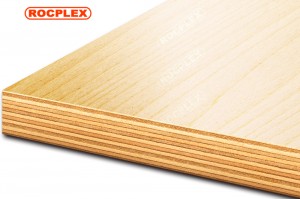
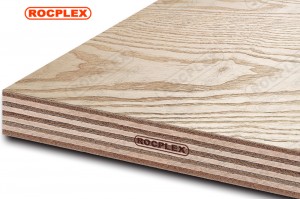
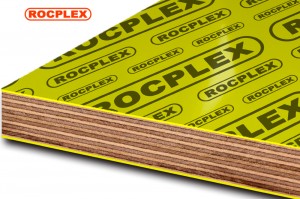
STRCTURAL USE BOARD
 Learn moreROCPLEX structural plywood, structural LVL, structural OSB and etc
 -
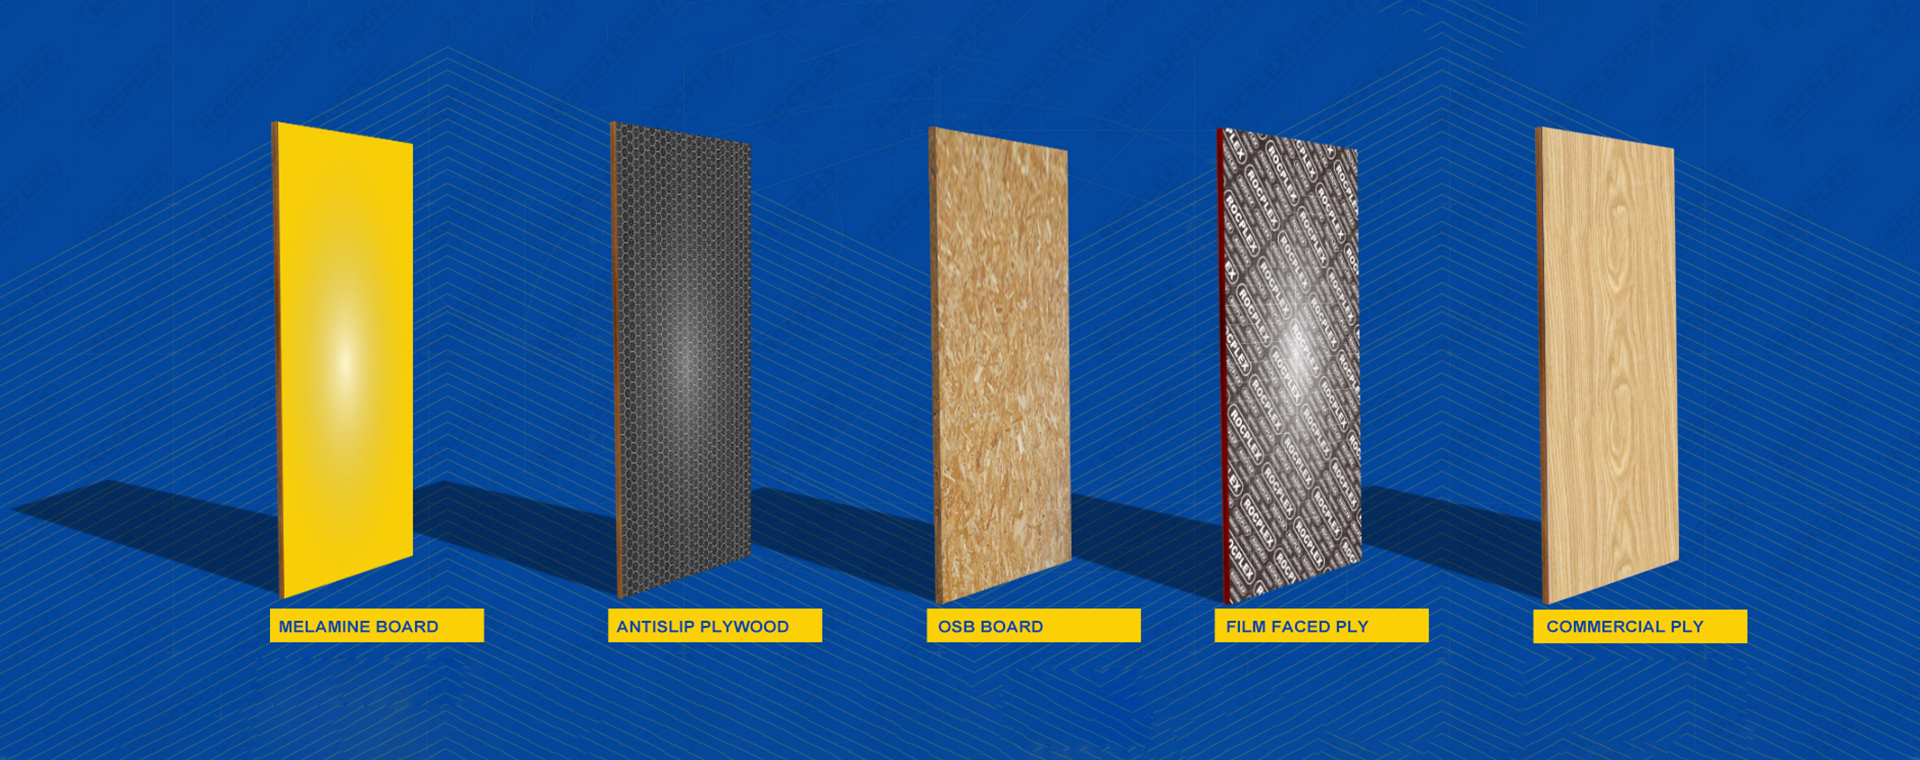
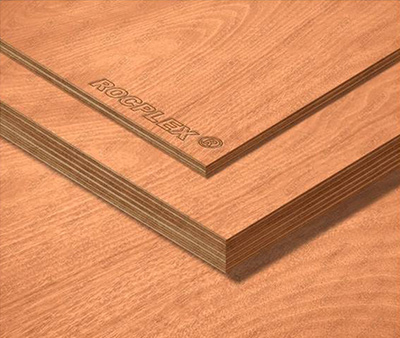
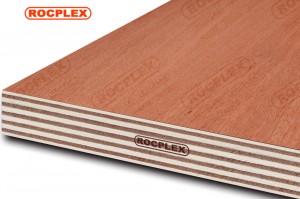
HOUSES / CUPBOARD USE BOARD
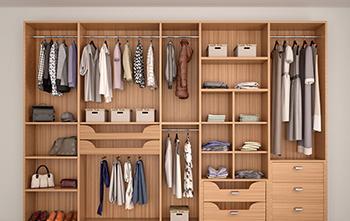 Learn morehouses use board and cupboard use board include plywood, chipboard, MDF or melamine board.
 -
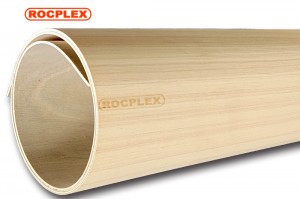
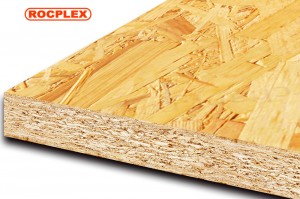
PACKING USE BOARD
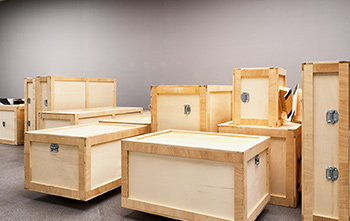 Learn morepacking board include packing plywood, packing OSB and MDF. For packing use board.
 -
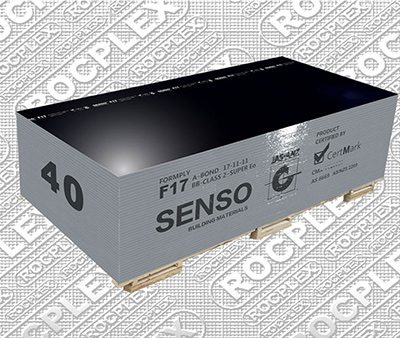
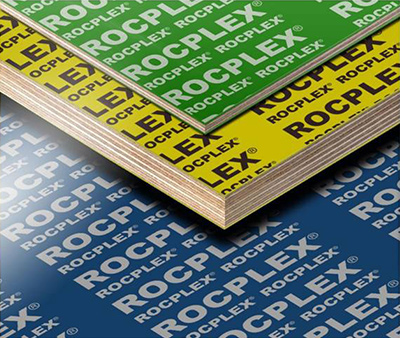
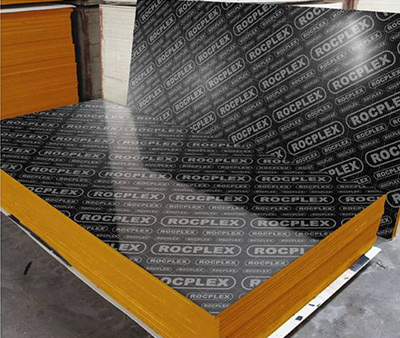
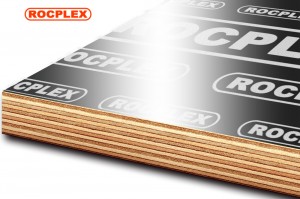
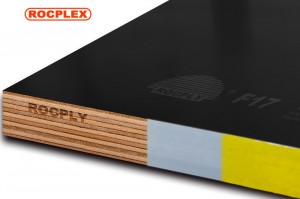
FORMWORK USE BOARD
 Learn moreconstruction formwork use board include film faced plywood, formply and plastic plywood.
 -
OTHER SPECIAL USE BOARD
 Learn moreOther special use wood board include plywood board, OSB, MDF, LVL and etc.
Timber Manufacturer & Whosaler
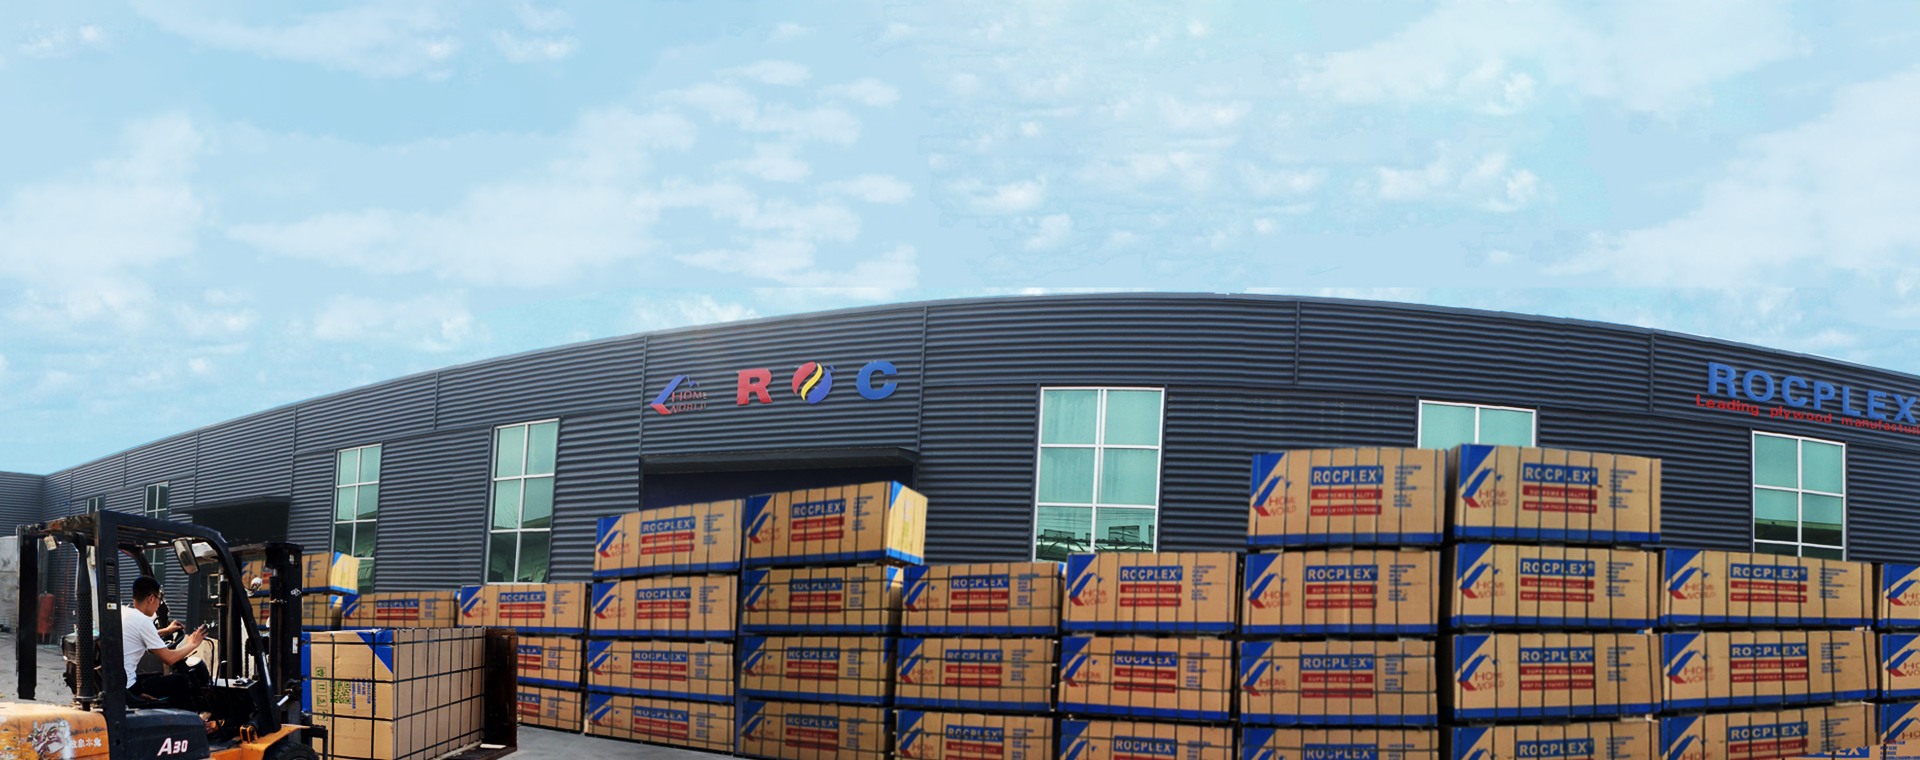
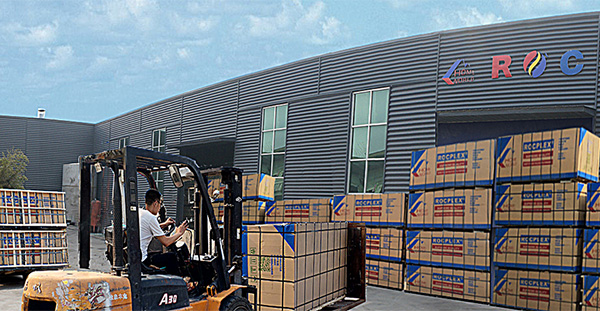
ROC International
Home World Group is the largest manufacturer and exporter of plywood and related products in China, which was founded in 1993 with 6 subsidiaries. We are now enjoying 73 production lines of film faced plywood and fancy plywood.
Our productivity of all kinds of plywood is 220,000m3 and 1,000,000m3 for film faced plywood each year.

-
 8000+Containers Export Till Date
 -
 SupplyUnited Nations Global Marketplace
 -
 28Years Of Experience
 -
 38Countries We Haved Exported To
We Are Worldwide

Agent Service
ROCPLEX Sourcing Agent Services Still worrying about building materials sourcing from China? Then it would be a wise choice for you to choose us. Characterized by one stop procurement services, ROCPLEX enables you to source from China in an unexpected but amazing way.
Below are BENEFITS you can enjoy…
Overseas office
Excellent purchasing department and quality control department, and of course, professional merchandiser. So ROCPLEX has enough confidence to be your reliable overseas purchasing department. 25 years of wood family business let us have the confidence to do a good job in building materials products purchasing agent.
-
 CHINESE FAMOUS TRADEMARK
-
 JIANGSU QUALITY TRUSTED PRODUCTS
-
 3 AAA CORPORATE CREDIT
What We Do
- ROCPLEX GLOBAL AGENT
- INDUSTORY PRODTCTION
- IMPORT AND EXPORT SERVICE
- PLYWOOD OEM SERVICE
- PLYWOOD INSPECTION SERVICE